Silhouette Area Calculator
Measure silhouette areas from images with calibrated ruler.
Silhouette Area Calculator is a front-end-only web tool that turns high-contrast images into measurable areas—without uploading anything to a server. Drop in a screenshot, scan, photo, drone frame, microscope still, diagram, or any image where the subject can be separated from the background by brightness. The app builds a black/white mask using a threshold, counts the foreground pixels, and reports area as pixels and percent coverage. When you calibrate scale with the built-in ruler, it also converts pixel measurements into real-world area automatically.
At its core, the calculator answers a simple question: “How much of this image is the shape I care about?” If the mask looks correct, the math is straightforward and repeatable. This makes it ideal for quick, transparent measurements when you don’t want to install heavy desktop software or rely on opaque cloud processing.
How it works
Load an image. You can upload a local file (recommended) or load by URL (only if the remote server allows CORS, because the browser must be allowed to read pixels).
Convert to grayscale. The tool reduces each pixel to one brightness value (0–255).
Threshold into a binary mask. Pixels darker than the threshold become “foreground” and the rest become “background.” If your image is inverted (white object on dark background), you can invert the logic with a single click.
Count pixels. Foreground pixel count divided by total pixels gives percent coverage. Foreground count is also reported as a raw number for audits, change tracking, and comparisons.
Convert to real area (optional). Once a distance scale is known (units per pixel), the tool converts pixel area using: realArea = pixelArea × (unitsPerPixel)².
Threshold controls (manual + automatic)
Different images need different thresholds. For crisp black-and-white imagery, almost any mid threshold will work. For images with compression artifacts, shadows, or gradients, the slider gives you precise control over what’s considered foreground. If you want a one-click starting point, Auto Threshold uses Otsu’s method to estimate a cutoff that best separates dark and light populations. You can always tweak afterward and immediately see the mask update.
Speed control without losing the big picture
Very large images can be slow to analyze if you read every pixel at full resolution. The calculator includes a “max pixels” control that allows the analysis to downscale internally to keep the UI responsive. Percent coverage is usually stable under reasonable downscaling, but extremely thin lines or tiny gaps can disappear if you downscale too aggressively. If you’re measuring fine details, raise the max-pixels limit so the analysis runs closer to the original resolution.
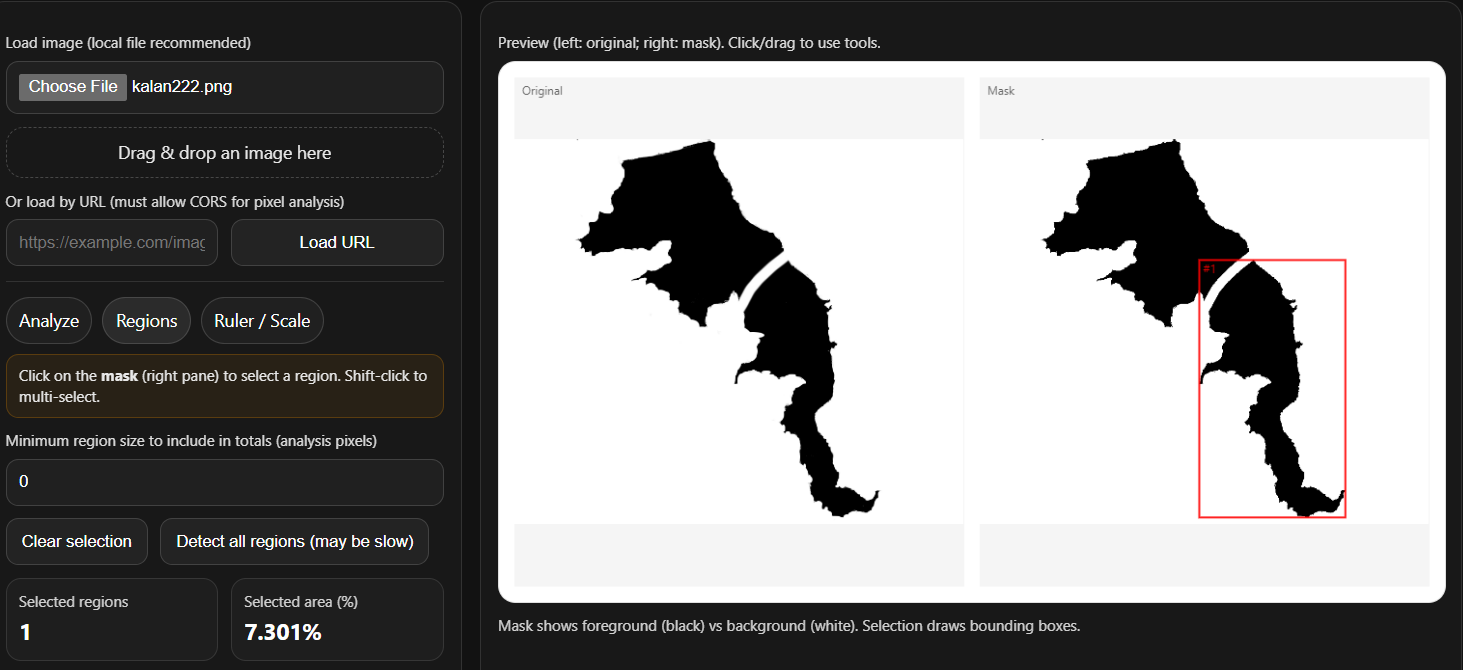
Region selection (measure only what you click)
Real-world images often contain multiple disconnected shapes: separate blobs, islands, speckles, holes, labels, or repeated objects. Regions mode lets you measure specific components instead of “everything dark.”
Click on the mask (the black/white pane) to label the connected component under your cursor.
Shift-click to multi-select multiple components.
Clear selection to start over quickly.
Set a minimum region size to ignore tiny specks and noise.
Selected regions get highlighted, and the tool reports the combined area of only the chosen shapes. This is especially useful when the foreground includes unwanted artifacts (text, logos, dust, UI elements from screenshots) that you want to exclude from the measurement.
Ruler and scale calibration (pixels → real units)
Pixels are a great intermediate unit, but most projects need square meters, square millimeters, square feet, or another real unit. The ruler tool provides two functions: measurement and calibration.
Measurement: In Ruler/Scale mode, click and drag on the original image pane to draw a line. The app displays the line length in pixels (based on the original image dimensions, not the downscaled analysis grid).
Calibration: If you know the real distance represented by that line (for example, a marked dimension on a drawing, or a known distance on a map), enter that real distance and choose a unit. The tool computes units-per-pixel using:
unitsPerPixel = realDistance / pixelDistance
Once units-per-pixel is set, the calculator can automatically show:
Foreground area in real units (unit²)
Selected region area in real units (unit²)
If you prefer, you can skip the ruler and enter units-per-pixel manually. The scale is deliberately general: it can represent meters per pixel, millimeters per pixel, inches per pixel, or even non-physical units like “cells per pixel,” as long as you interpret the squared unit sensibly.
Practical accuracy tips
Use the longest calibration line you can. A 10-pixel ruler line is fragile; a 500-pixel ruler line is robust.
Calibrate on the same image you analyze. If you crop or resize images elsewhere, recalibrate.
Avoid perspective distortion. Calibration assumes uniform scale across the image. If you photograph a surface at an angle, pixels won’t represent a constant distance everywhere.
Clean up the input when possible. High contrast and minimal artifacts produce cleaner masks.
Sanity-check with a known area. If you can, test the workflow on a shape with a known size to validate your settings.
Common use cases
Because it’s silhouette-based, the tool is broadly applicable:
Science and lab work: coverage of colonies, stain masks, segmented microscopy regions
Fieldwork and mapping: shaded region area from a map screenshot (with a known scale)
Manufacturing/QA: paint coverage, coating areas, cutout templates, gasket silhouettes
Sports and biomechanics: footprint/contact patch silhouettes, wear patterns
Design and printing: stencil coverage, inked region ratios, layout occupancy
Education and demos: teach thresholding, segmentation basics, and area estimation with immediate visual feedback
Privacy and deployment
Silhouette Area Calculator runs entirely in the browser. That means images can remain on the user’s device, which is useful for confidential drawings, internal documents, and sensitive imagery. From a deployment perspective, it’s just static HTML/CSS/JS: host it on any website, ship it as a single file, or run it locally. Once loaded, it can even work offline.
Limitations (and how to think about them)
Thresholding is not semantic segmentation. If foreground and background share similar brightness, manual tuning will be needed, and some errors may be unavoidable.
Any real-world conversion inherits calibration error. If the reference distance is uncertain by 2%, the area can be off by roughly 4% because area scales with the square of distance.
Connected components treat touching shapes as one region. If two silhouettes touch by even a single pixel, they become one region; conversely, a tiny gap splits one object into multiple regions.
Downscaling can remove thin structures. Increase the max-pixels setting for fine detail work.
A quick workflow you can recommend
Upload an image.
Adjust threshold until the mask matches the silhouette you intend to measure.
(Optional) Switch to Regions and click the exact components you want.
Switch to Ruler/Scale, draw a reference line, and enter its real distance to calibrate.
Read pixel area, percent coverage, and (if calibrated) real area.
Silhouette Area Calculator is designed to be simple, transparent, and easy to validate: the mask is visible, the rules are clear, and the numbers update instantly as you adjust. If you need a general-purpose “area from image” calculator that your visitors can use right away, this tool fits neatly into a website and explains itself through interaction.