Offline Plot Digitizer
Offline tool to digitize chart images into CSV
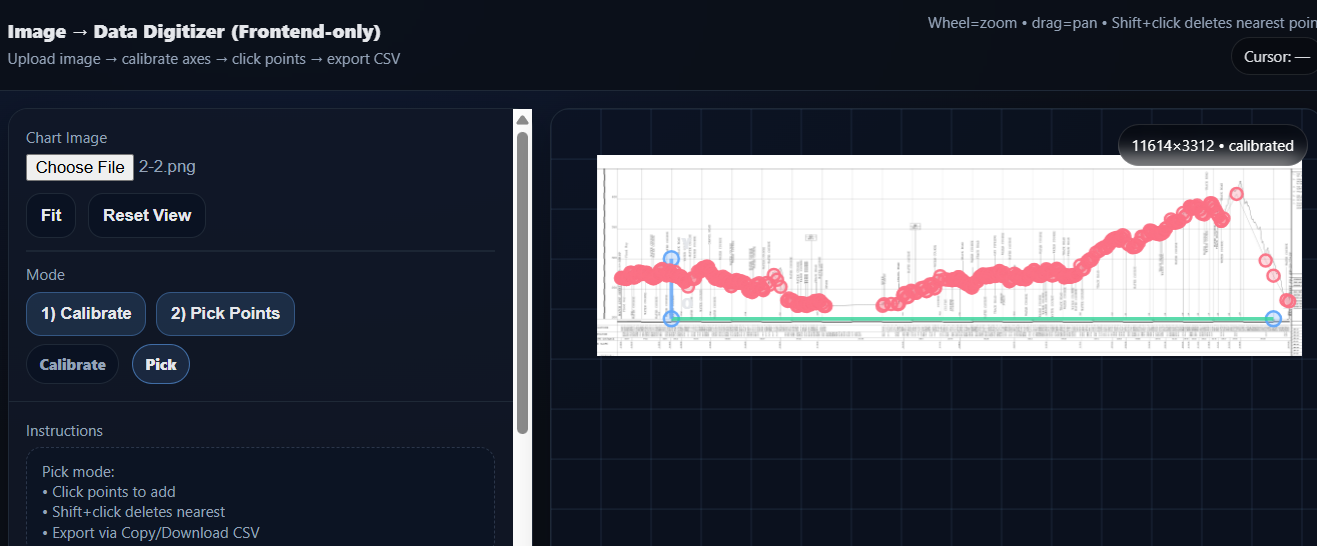
Offline Plot Digitizer is a lightweight, privacy-first tool that helps you convert chart images into real, usable data—completely offline, with no installs and no backend. If you’ve ever received a report as a screenshot, found an important figure buried in a PDF, or needed numbers from a plot when the raw dataset wasn’t available, this app is built for exactly that moment. You load an image of a chart, calibrate the axes, click along the curve (or points of interest), and export everything as a clean CSV file that you can open in Excel, Google Sheets (later), Python, R, MATLAB, or anything else.
The workflow is intentionally simple and reliable. First, you upload a chart image (PNG/JPEG). The image appears on the right panel inside an interactive canvas that supports pan and zoom—drag to move around and use the mouse wheel to zoom in for precise clicking. Next, you calibrate the axes by clicking three reference points directly on the image: the origin point, a known point on the x-axis, and a known point on the y-axis. After that, you type the real numeric values that those reference points represent (x0/x1 and y0/y1). With calibration applied, the tool can translate any pixel location you click into meaningful (x, y) data values using the same scale and orientation as the original chart.
Once calibrated, switch to Pick mode and start digitizing. Each click adds a datapoint and immediately computes its x and y values. You can zoom in tightly and click along a line chart, plot scattered points, or sample key points from a curve. If you make a mistake, you can delete the nearest point with Shift+click, undo the last point with Ctrl/Cmd+Z, or clear the entire set and start again. As you work, your collected points appear in a table, showing both the computed data coordinates and the underlying pixel coordinates (useful for debugging calibration or repeating work consistently).
To make digitizing faster and more accurate, Offline Plot Digitizer includes a live “hairpin” crosshair cursor. As you move your mouse over the image, it displays your current position on the chart: the pixel coordinates and, if calibration is active, the corresponding data coordinates (x and y). This is ideal for checking whether your axis mapping looks right before you commit to clicking points, and it helps you hover precisely over tick marks, grid intersections, or curve vertices.
Exporting is straightforward. When you’re satisfied with your points, you can download a .csv file instantly—no accounts, no uploads, no internet connection required. The CSV includes an index plus x and y columns in data units, along with the original pixel coordinates for traceability. This makes your extracted dataset reproducible and easy to validate, especially in technical or academic contexts where provenance matters.
Because the app is fully frontend-only, it’s well suited for sensitive environments and air-gapped machines. Everything runs in your browser—your image never leaves your computer, and there are no external dependencies or third-party scripts. You can keep the file on a USB stick, open it on any modern computer, and digitize charts anywhere you’re allowed to use a browser. This also makes it a practical teaching tool: students can learn how digitization and coordinate transforms work without installing software or relying on online services.
Offline Plot Digitizer works best with clear charts where axis tick marks and labels are visible and lines/points are distinguishable. For best results, use a high-resolution image, zoom in when clicking, and choose calibration points that are far apart (to reduce error). If your chart uses logarithmic axes, you can enable log10 scaling for x and/or y before applying calibration. And if a chart is rotated or slightly skewed, the three-point calibration approach still handles it well, because it doesn’t assume perfectly horizontal and vertical axes—it learns the axis directions from your reference clicks.
Whether you’re extracting a curve from a research paper, recreating a dataset from a slide deck, or quickly turning a graph into a spreadsheet for analysis, Offline Plot Digitizer gives you a fast, offline, and transparent way to get the numbers back.
Help / quick-start guide:
Upload your chart image.
Click 1) Calibrate.
On the image, click Origin → X reference → Y reference.
Enter x0/x1/y0/y1 (and enable log10 if needed).
Click Apply Calibration.
Switch to 2) Pick Points and click to add points.
Shift+click deletes the nearest point
Ctrl/Cmd+Z undoes the last point
Click Download CSV to export.
Tips: use Fit to center the chart, zoom in for precision, and pick calibration points that are as far apart as possible for accuracy.